DSpark on MAX: making speculative decoding beat vLLM

How speculative decoding for Gemma4 on Modular's MAX went from 30% behind vLLM under load to outside its latency/throughput curve on every dataset at concurrency 8 and 64, on one B200.
From 30% behind vLLM under load to outside its latency/throughput curve on every dataset at concurrency 8 and 64 — an optimization worklog from my summer building speculative decoding for Gemma4 on one B200.
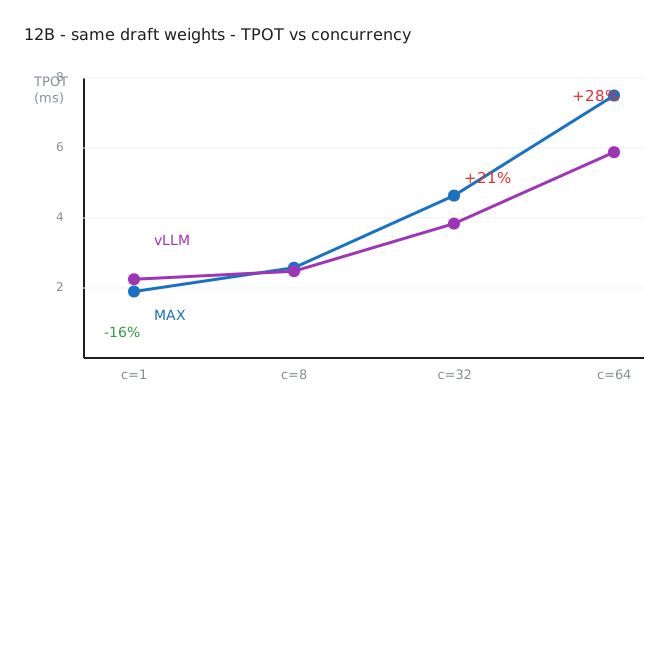
When we first benchmarked DSpark speculative decoding for Gemma4-12B on Modular’s MAX against vLLM — identical drafter weights on both engines — MAX won at concurrency 1 and lost under load: about 23% slower per token at concurrency 32, 30% at 64. The obvious first guess, ours included, was that our GPU kernels must be slow at large batch sizes.
That guess was wrong. We’ll see that our kernels were already faster than vLLM’s; that the cost was prompt scheduling, at four times vLLM’s price per prompt; that folding prompts into decode steps and a four-kernel pass closed most of the gap; and that coalescing prompt arrivals flipped the last cell. Speculation itself is worth up to 4.0× per token over not speculating.
The scoreboard
One cell tracks the whole campaign: Gemma4-12B, the InstructCoder code-editing dataset, concurrency 64, mean time per output token (TPOT, ms — lower is better). This is the cell where we started 30% behind.
| step | ms/token | vs vLLM (5.94–6.06) |
|---|---|---|
| where we started | 7.77 | ~30% behind |
| mixed prefill+decode batches | 6.89 | behind |
| + logits-tail kernels (softmax/argmax) | 6.41 | behind |
| + all-greedy sampler lane | 6.03 | at range |
| + drafter argmax (small at this cell) | 6.03 | at range |
| + prompt coalescing | 5.92 | below it |
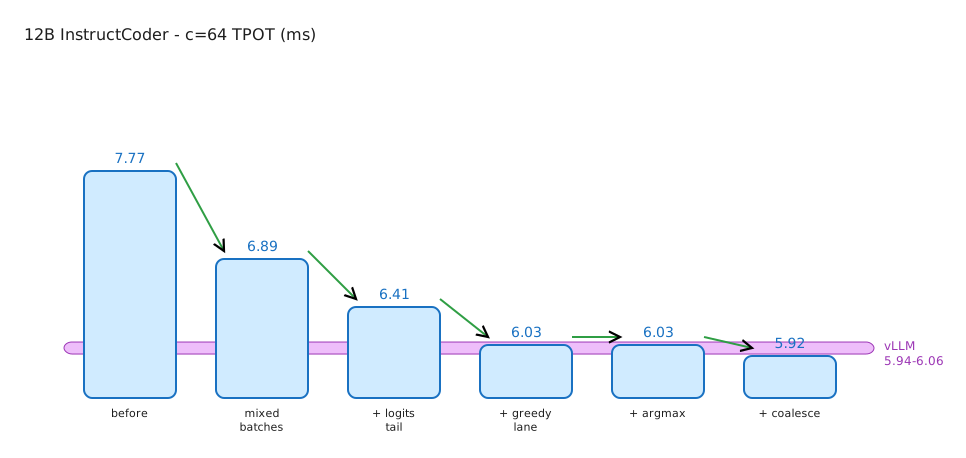
The final 5.92 ms sits under vLLM’s 5.94–6.06 across repeated runs, ranges not overlapping — vLLM’s best run loses to our worst here. Each row was picked by a measurement before it was built. The back half of the post walks the rows in order. First, the thing being measured.
What DSpark is
A language model generates one token at a time, and each token requires reading every weight out of GPU memory — tens of gigabytes per step for a 31B model. Decode is memory-bound; the math units sit idle while the weights stream past. That idle arithmetic is the resource we spend for the rest of the post. Speculative decoding spends it on guessing: a small “drafter” guesses several tokens ahead and the target checks them all in one step. Checking 8 tokens reads the same weights as generating 1; wrong guesses are discarded, and output is identical to not speculating.
The accounting that runs through this post: per-token latency = step time ÷ tokens produced per step. Every fix below improves one of those two terms.
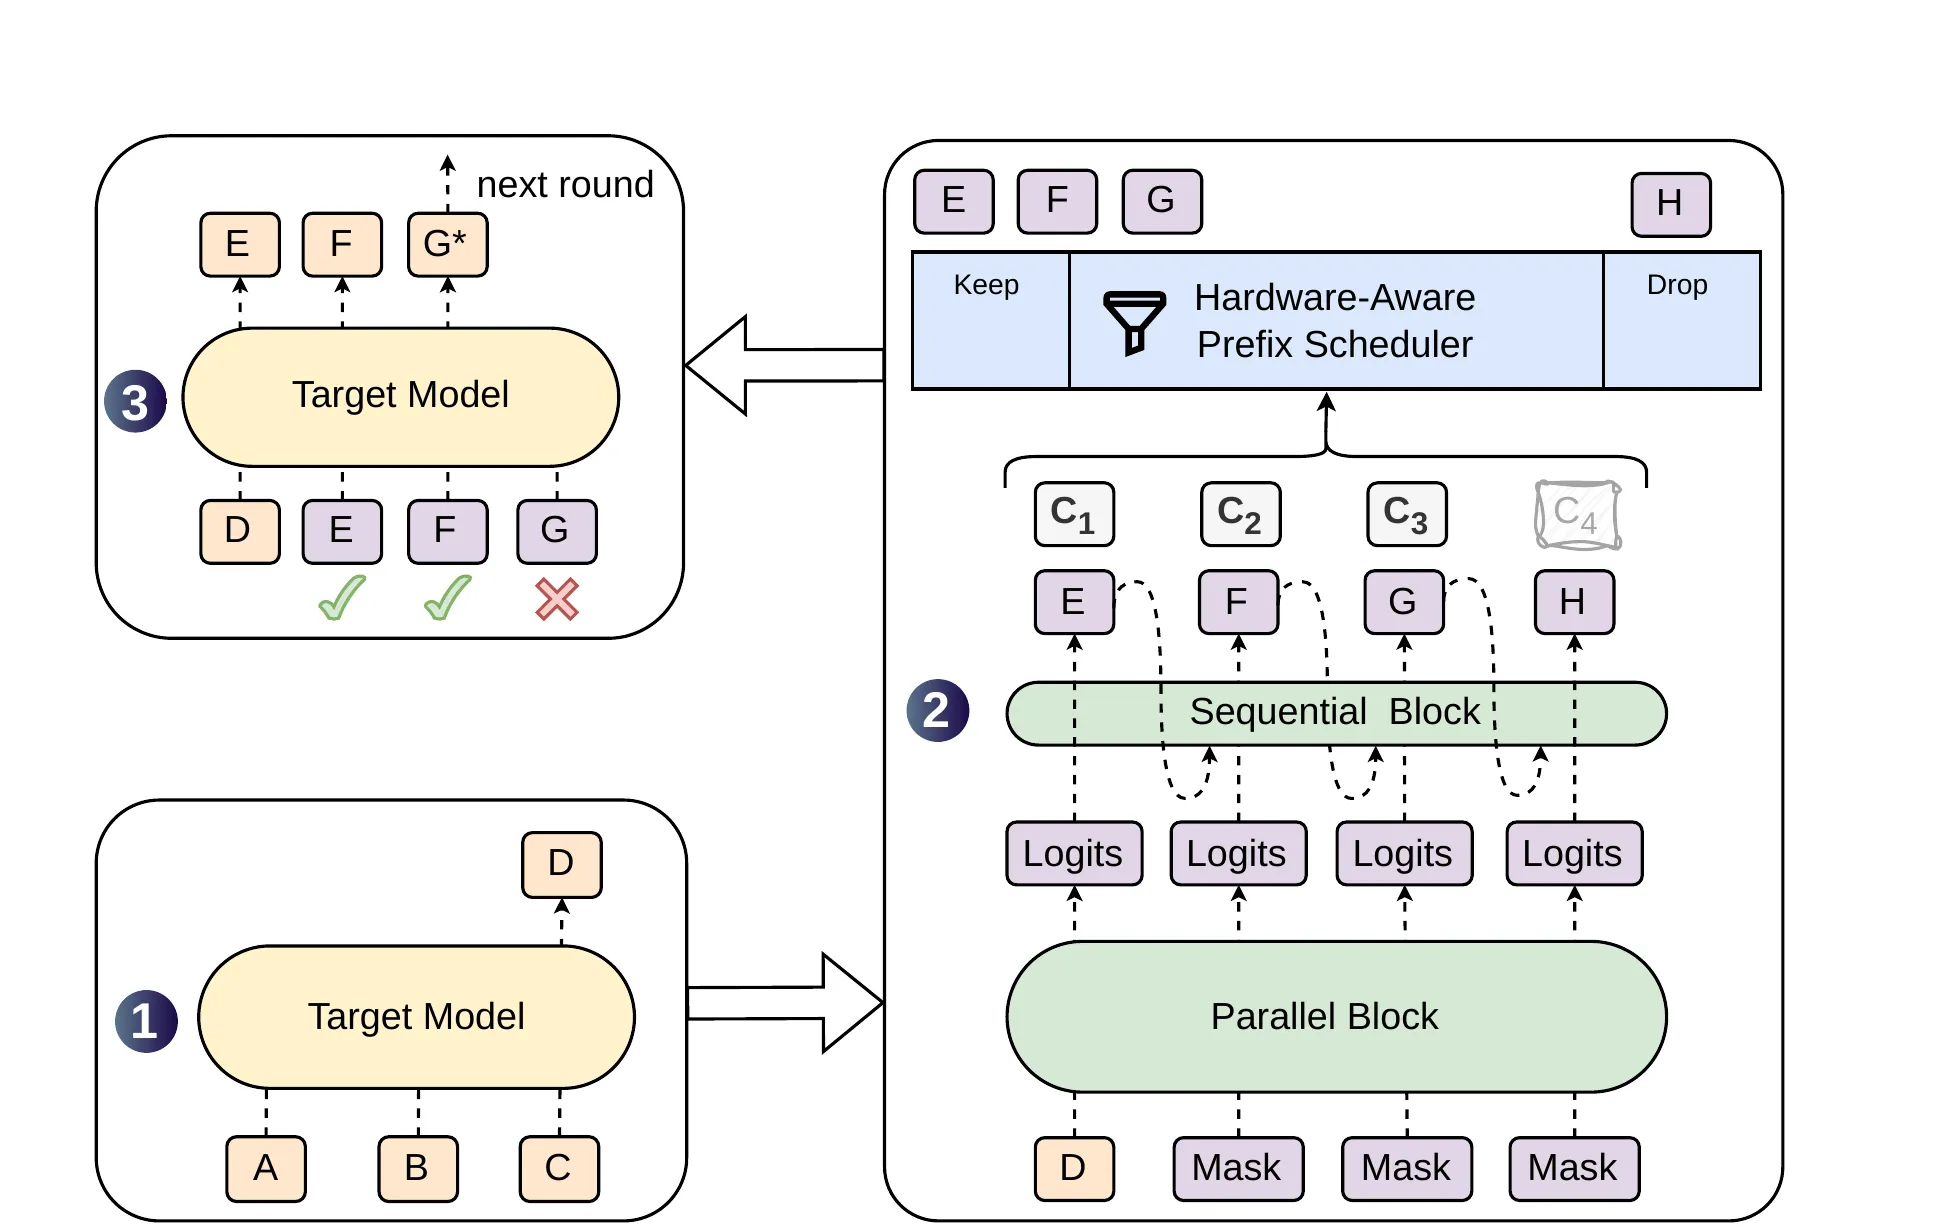
Figure 1 of the DSpark paper (arXiv.05147, DeepSeek-AI) — the architecture and decoding cycle.
DSpark is DeepSeek’s drafter design, introduced in DSpark: Confidence-Scheduled Speculative Decoding with Semi-Autoregressive Generation. Three things distinguish it:
- It taps the target’s hidden states. The drafter — roughly a billion parameters on a frozen target — reads hidden states from several of the target’s layers, plus the token embeddings. That head start is why ~1B can usefully track 31B: roughly 3 accepted tokens per step on code.
- It is block-parallel. It guesses all K=7 future positions in one forward pass, holding unknown slots with MASK tokens, so drafting cost is roughly flat in K (EAGLE-style drafters run once per guessed token).
- Chaining is cheap. Turning scores into an actual 7-token chain is a low-rank bias keyed on the previous chosen token, then an argmax — a handful of cheap GPU ops.
For contrast, the other methods here: MTP attaches a tiny drafting head inside the target itself (cheapest possible step, sequential in K). DFlash is another block-parallel drafter that reads the target’s attention cache directly. All three share MAX’s verification machinery.
The targets are Gemma4-12B and Gemma4-31B; every drafter checkpoint is published.
Correctness, then 1.3×
Milestone one was correctness: a new MAX architecture for the unified target+draft graph — weight adapters, chaining head, acceptance verification (public commit). On ShareGPT chat at concurrency 1 it delivered 317 vs 129 tok/s over the unaccelerated target (2.45×), accepting 2.23 of 7 drafts per step.
The first perf campaign (public commit) landed three slices, judged together:
| slice | kernel effect | e2e alone |
|---|---|---|
| device graph capture (record/replay) | removes ~9.85 ms/step host-launch floor | +5.2% c=1 |
| multi-row GEMV for the chaining head | 258 → 31 µs/call (8.4×), 0.52 → 5.21 TB/s | ~0 |
| streaming argmax (replaces top-k K=1) | 41 → 5.9 µs (6.95×) | ~0 |
Those two “~0”s are the load-bearing lesson. The decode step was
max(host-launch floor, GPU work), and the two terms sat at 9.85 vs
9.71 ms — within 0.15 ms. Each kernel fix alone lowered a term that was not
binding, and measured as a null. Merged with capture, the step fell
9.90 → 7.62 ms and now tracks its own GPU-busy time to within 0.05 ms. Judged serially, both kernel wins would
have been reverted as failures.
Campaign result: +31.6% at concurrency 1 on ShareGPT (309.7 → 407.5 tok/s), and 2.44× → 3.21× over the unaccelerated target, both arms capturing.
So why was the chaining-head GEMV slow? Not bandwidth: the library launched 262,144 one-warp blocks, and kernel time was grid size ÷ dispatch rate. Packing several rows per warp fixed it, bit-exact.
And argmax had lowered to a top-k K=1 path that copied the entire 524 KB
row and heap-scanned it on 8 of 148 SMs; a streaming (max, index) pass
replaced it.
One planned slice died: top-M pruning of the chaining head, ranked the #1 lever before measurement, measured net-negative (−5.6% tok/s, acceptance −0.044).
We also tore down the one public prior-art datapoint, Makora’s “Reading the future with Gemma 4” and their Apache-2.0 checkpoint. The stealable idea was the reduced 32k draft vocabulary, which the 31B checkpoint we served next has natively.
Scaling to 31B
The 31B bring-up (arch, plus thinking-phase and structured output) started at 178 tok/s at concurrency 1 on ShareGPT — 2.27× better per-token latency than the unaccelerated target, both eager. Three compounding levers followed:
| lever | measured | note |
|---|---|---|
| NVFP4 target weights (4-bit — halves the weight stream) | 1.21× TPOT (6.39 → 5.19 ms) | acceptance flat (−0.44%): drafting from quantized hidden states didn’t hurt |
| FP8 KV cache | −6.1% TPOT c=16, flat c=1 | KV pool 74.9 → 59.9 GiB = 1.475× the tokens; a capacity lever |
| device graph capture | −20.4% TPOT c=1, −9.1% c=16 | replay the recorded step, skip launch overhead |
Capture also surfaced a crash under sustained concurrency-16 churn; the root cause was a real kernel bug: a NaN draft logit made ArgMax return its reduction-identity sentinel as data, which then indexed a gather out of bounds. Two public kernel fixes came out of it.
I also brought up DFlash for 31B on the same machinery (commit) — turning one method’s benchmark into a three-way comparison.
Losing a fair fight
With three methods on one engine, which is best? First, a K-sweep (K = tokens drafted per step): K ∈ {3, 4, 5, 7} across ShareGPT and the decode-heavy sonnet workload at concurrency 1 and 16. No K beats K=7 on any workload at c≤16; DSpark’s K is capped by the drafter’s trained width of 7, not by economics.
Then the cross-method comparison — sonnet, concurrency 1:
| method | step ms | tokens/step | TPOT ms |
|---|---|---|---|
| DSpark K=7 | 11.6 | 3.62 | 3.20 |
| MTP K=5 | 12.2 | 5.54 | 2.20 |
| DFlash K=15 | 16.8 | ~7.4 | 2.27 |
DSpark has the cheapest step of the three and still loses — the deficit is more than 100% in tokens per step. DFlash overcomes a 45% step-cost handicap purely with block length: verification is nearly width-invariant, so the cheapest tokens are the ones a wider-trained drafter would add. Neither acceptance rate nor step cost is the metric; tokens per step ÷ step cost is.
The fix is known but doesn’t exist yet: a block-16 DSpark checkpoint, which by the slot economics would land around TPOT 1.6–1.9 ms here. No kernel work closes a tokens/step gap — we costed the entire remaining kernel ceiling and DSpark still loses to MTP-K5 on sonnet. Method choice settled; the vLLM gap remained.
Losing under load
So why were we losing under load? On the 12B board, with identical drafter weights and matching measured acceptance, the gap had to be engine quality — and the standing guess was still our kernels. We profiled both engines the same way: record the full GPU timeline under a fixed benchmark, clocks pinned, and carve it into the server’s steps.
The result was the opposite of the kernel guess: our decode steps were faster than vLLM’s. At concurrency 32 the total gap was 3.78 ms per generation round. The prompt-handling bucket alone was +4.03 ms — more than the entire gap, possible only because we were ahead on the other bucket.
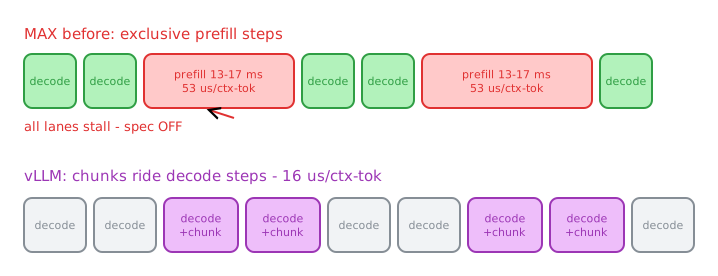
Both engines see the same prompt stream; the difference was the price per event. MAX ran each prompt as an exclusive step — all 32–64 active generations froze 13–17 ms while one prompt ran alone, speculation off. vLLM folds a slice of prompt work into the running decode step, lengthening it only ~6 ms. Same events, four times the price, paid in everyone’s latency.
Mixed batches
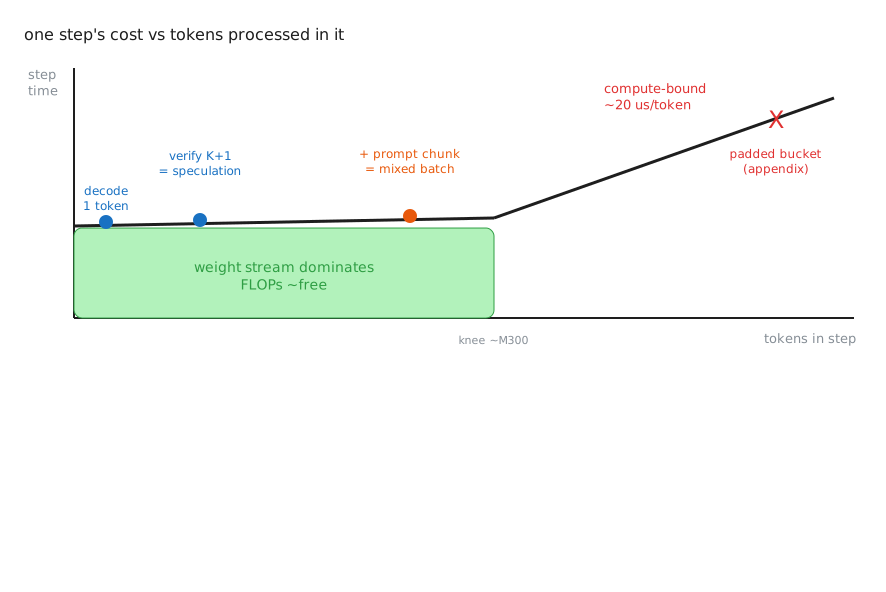
A step’s cost is roughly flat in the tokens it processes until arithmetic catches the memory streaming. One decode token sits on the flat region; verification’s 8 tokens sit on it — that is why speculation works at all. A prompt chunk of a couple hundred tokens also fits. Verification was already prefill riding the decode step’s free arithmetic, so we let real prefill ride the same step.
MAX’s batches became mixed: prompt chunks and decoding requests share one model step, results are committed exactly and independently per request, and speculation stays on when prompts are present. Two gates proved it changes scheduling and nothing else: acceptance unchanged within ±0.6%, output byte-for-byte identical with the fix on or off.
Measured on 12B, per-token latency fell 8.6–12.9% across concurrency 8 to 64.
The honest cost: time-to-first-token rose 48–75% at high concurrency, landing at vLLM’s own first-token latency — the same trade they made, buying back every user’s streaming speed.
Because this fixed the scheduler, not the model, every method inherited it; on 31B the same stack improved DSpark’s TPOT at every concurrency with acceptance unchanged — a strict Pareto improvement. Four kernels remained.
The kernel pass
Each fix ran the same loop: the step-time budget names a kernel, the kernel profiler names its limiting resource, the fix targets that limiter, an end-to-end benchmark confirms. All four diseases differed.
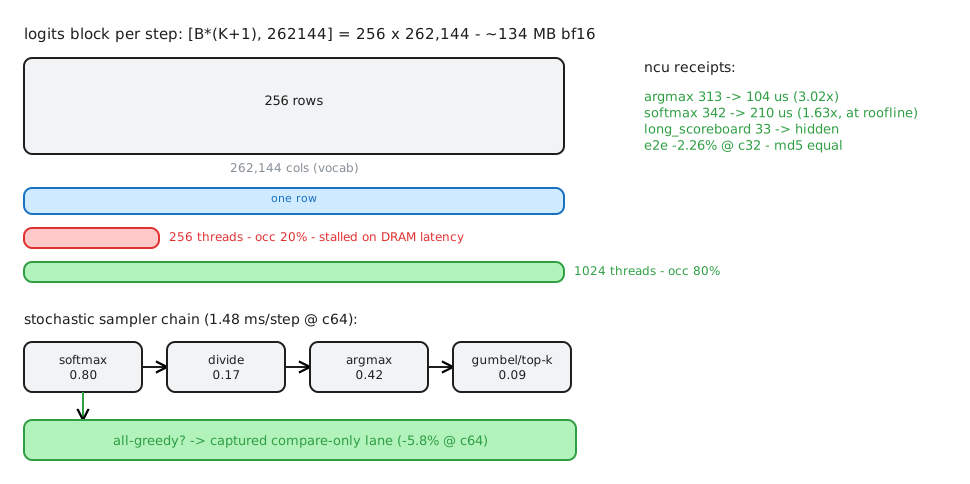
- The vocabulary reductions were starved of parallelism. Three small kernels (a softmax, two argmaxes) walk the score block in the figure with 256 threads per row, stalled on memory. At 1,024 threads per row they run at the memory-speed limit: 2.3% faster per token end to end, output identical.
- The sampler did work that shouldn’t exist. Verifying under random sampling needs ~1.5 ms of probability math per step — but most traffic is greedy, where acceptance is just “does the guess equal the target’s best token.” A captured compare-only lane for all-greedy batches: 5.8% faster per token at c=64, full path kept for sampled traffic.
- The drafter’s argmax was compute-starved — the mirror image of #1: memory 94% idle, arithmetic pipes saturated. Eight values per load amortized the bookkeeping: 1.87× the kernel (small at the c=64 cell).
- The small-batch NVFP4 matmuls used the wrong variant. A decode-sized 4-bit matmul is pure weight streaming, and the picker chose a large-batch kernel. A small-batch dispatch tier ran 17% faster on those shapes; the micro-benchmark predicted ~3.6% end to end on 31B and serving measured 3.2%. When prediction agrees with measurement, you know your model of the system is right.
One cell still lost.
The last 1.5%
The board now read: winning at concurrency 1, 8, 32 — and 1.6% behind at 64, about 0.4 ms per step. We decomposed the residue into every plausible suspect: accounting artifacts, slow finishers, host stalls. Each measured approximately zero. What remained was the number of mixed steps. A step containing a prompt chunk cannot use the pre-recorded fast-replay path, and prompts arriving one at a time meant paying that surcharge on most steps. A replay of the measured timeline predicted that briefly holding arriving prompts, so at least two share one mixed step, would be worth −2.0%. We built exactly that — prompts wait at most a bounded number of steps — and measured −1.6%, flipping the last cell to 5.92 ms against vLLM’s 5.94–6.06 with ranges disjoint. Cost: worst-case time-to-first-token rose 17 ms.
The boards
The comparison setup in full, so the claim is checkable. One NVIDIA B200; greedy sampling, fixed seed, fixed work.
MAX vs vLLM 0.26.0 on identical DSpark drafter weights, plus SGLang MTP and TensorRT-LLM on the 12B per-engine board. The 31B arms all run the NVFP4 target + FP8 KV + capture; the 12B board is bf16 everywhere (no quantized 12B target exists). Five datasets: code (HumanEval), math, InstructCoder (code editing), ShareGPT (chat), sonnet (poetry continuation — decode-heavy).
Note (What the MAX arms ran)
The final-week optimization stack (mixed-batch speculation + prompt
coalescing, opt-in flags on), still in review as draft PRs when my
internship ended — stack-preview numbers, not landed-main numbers. vLLM
was re-baselined same-session on code/math/sonnet; its InstructCoder/
ShareGPT rows carry from the prior day. Two 31B baseline windows ran at a
hotter GPU clock (1965 MHz), which flatters the baselines — the quoted
wins there are conservative lower bounds.
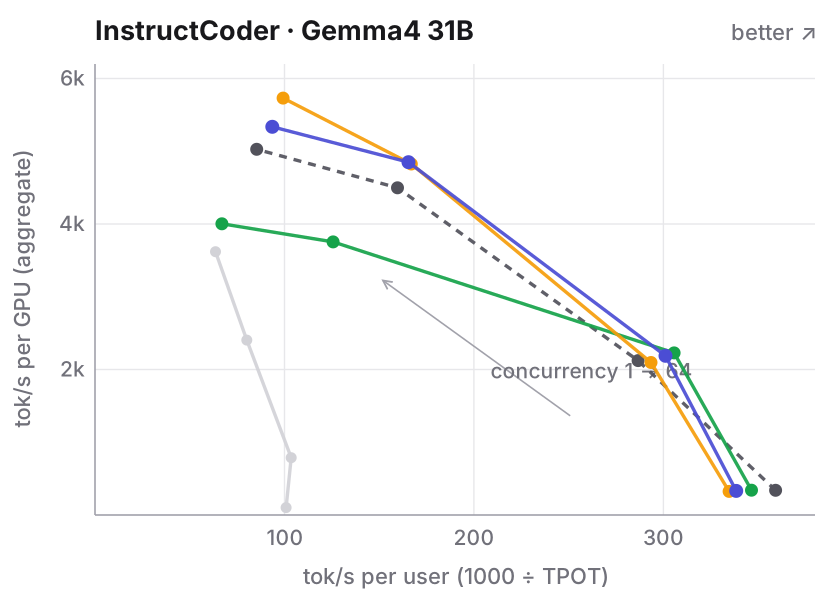
InstructCoder, Gemma4-31B. Curves: DSpark K=7 (indigo), MTP K=7 (amber), DFlash K=15 (green), vLLM 0.26.0 with the same DSpark draft (dashed gray), no speculation (light gray). Up-and-right is strictly better.
On InstructCoder, speculation alone is worth 3.3× per user, identical output. Against vLLM, MAX’s methods sit outside its curve on both axes at concurrency 8 and above; vLLM keeps a small (~6%) edge at concurrency 1 on this board.
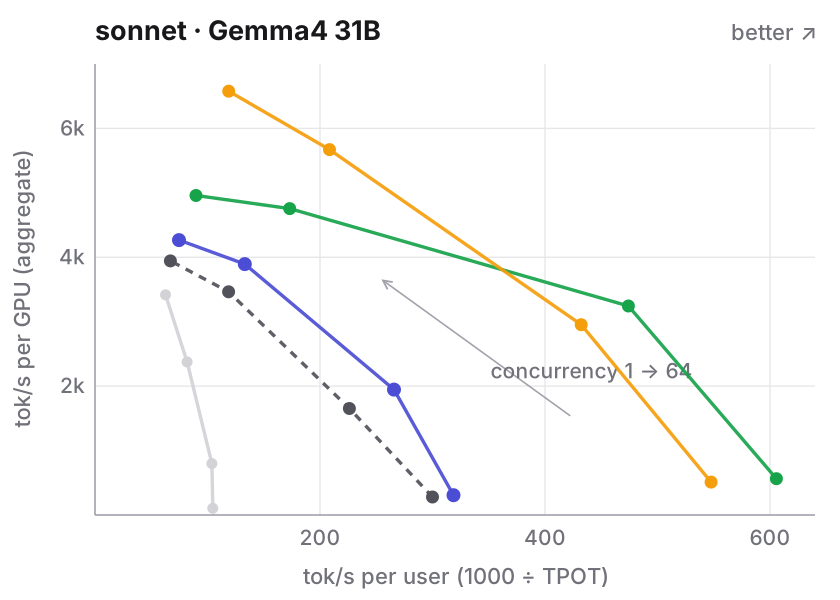
sonnet, Gemma4-31B — same legend. The decode-heavy board.
On sonnet, DFlash reaches 606 tok/s/user at concurrency 1 — 5.8× the no-speculation baseline and 2.0× vLLM — and every MAX speculation method beats vLLM at every concurrency. At c=64, MTP delivers +67% total throughput over vLLM.
On code, speculation is 4.0× per token over no-spec at c=1, still 2.0× at c=64.
Across all five datasets, at concurrency 8 and 64 the best MAX method beats vLLM on both axes on every board. In the identical-draft matchup, MAX DSpark wins TPOT against vLLM DSpark on all five boards at c=8, all five at c=64, and 4 of 5 at c=32.
The honest edges, all on the boards: vLLM keeps math at c≤32 by 3–6%, and c=1 on code and InstructCoder against DSpark by ~6%. DFlash takes c=1 on code back.
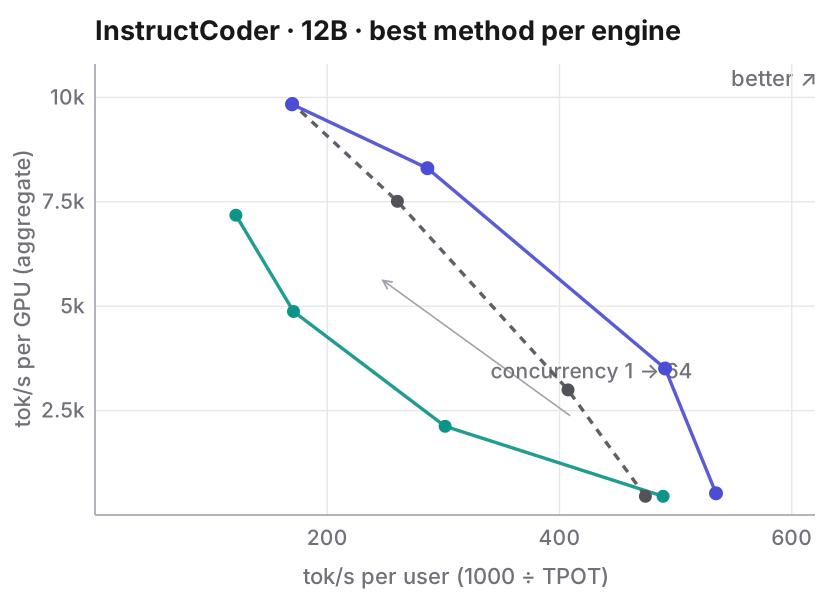
| engine, best method | c=1 | c=8 | c=32 | c=64 |
|---|---|---|---|---|
| MAX · DSpark K=7 | 1.870 (519) | 2.037 (3,509) | 3.494 (8,305) | 5.896 (9,836) |
| vLLM · DSpark K=7 | 2.110 (447) | 2.455 (2,995) | 3.840 (7,512) | 5.879 (9,852) |
| SGLang · MTP | 2.044 (447) | 3.317 (2,124) | 5.851 (4,873) | 8.244 (7,180) |
Gemma4-12B, InstructCoder, best method per engine. Cells: mean TPOT ms (aggregate tok/s).
At 12B, MAX is the fastest engine at concurrency 1, 8, and 32, and beats SGLang MTP at every concurrency. Per the full per-engine comparison it also leads TensorRT-LLM at 1, 8, and 32, parity-to-ahead at 64.
So which drafter should you run? The accounting predicts it. At low concurrency, block drafters win: their extra guesses ride the flat part of the step-cost curve. DFlash’s 16-token blocks make it the fastest per user, especially on predictable text. At high concurrency the batch has consumed the free arithmetic, so the cheapest step wins. MTP — no separate drafter at all — has the best throughput on every board at c=64, despite the lowest acceptance rate. DSpark sits between; all three share one contract on MAX, so you pick per workload.
What’s established
The opening guess was wrong: the kernels were not the problem, the scheduler was. Fixing that, then the kernels the budget named, took the headline cell from 7.77 to 5.92 ms against vLLM’s 5.94–6.06. The best MAX method now beats vLLM on both axes at concurrency 8 and 64 on all five datasets.
Two patterns repeated. A fix’s value depends on what else is binding: two real kernel wins measured as zero until capture removed the launch floor, and a top-ranked lever died when a different fix removed its premise. And no trace was trusted until it agreed with an independent clock.
Three levers remain, none built, all estimates. The confidence head would let the server shorten or skip guessing when acceptance looks unlikely; over half the verification width at high concurrency is wasted on rejected guesses. Estimated: 15–30% throughput. Wider-trained or domain-tuned drafters raise tokens/step directly; the block-16 DSpark checkpoint is the biggest number on the table, each additional accepted token worth ~34% on chat-like traffic. And vLLM still hides ~0.7 ms per step of scheduling behind an asynchronous scheduler that MAX exposes — the last structural idea of theirs worth taking.
The merged work is public — here is the commit trail. Thanks to my mentors and the MAX Serve team at Modular for treating a 2.4% trace-vs-client disagreement as a blocking bug. If you serve Gemma4, speculate. The arithmetic is idle either way; you may as well spend it.