How I beat NVIDIA at allocating pinned host memory

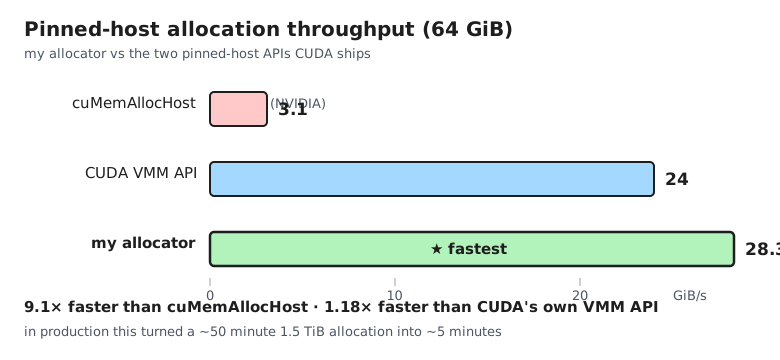
9× faster than cuMemAllocHost, and faster than CUDA's own VMM API too — an optimization worklog on an 8×B200 host.
Almost nobody allocates a terabyte of pinned host memory, which is why almost
nobody notices how slow it is. Serving large language models makes you the
exception: the biggest pool of memory on the box is the host DRAM you offload
KV cache into, and to move blocks at full PCIe/NVLink speed that memory has to
be pinned — page-locked and mapped into the GPU’s IOMMU so the copy
engines can DMA it directly. Asking CUDA’s stock cuMemAllocHost for the
~1.5 TiB pool I wanted on an 8×B200 box takes about 50 minutes. The server
sits there, apparently hung, before it can serve a single token.
This is the worklog of fixing that. We’ll see that the cost is per-page, so
chunking does nothing; that parallel faulting helps 4.6× until every thread
serializes on one kernel lock; that a one-line prctl splits that lock; and
that a serial driver lock then sets a ~28 GiB/s floor — 9× past the default,
50 minutes down to 5.
One number tracks it: effective allocation throughput, bytes allocated
over wall-clock. Experiments run at 64 GiB so each is quick, and the number
to beat is cuMemAllocHost at 3.1 GiB/s.
Step 0: where does the time actually go?
A single cuMemAllocHost of 499 GiB runs at 2.8 GiB/s. We can’t read the
call — it’s closed source — but what it must do per 4 KB page is no secret:
allocate the page, zero it, fault it into RAM, page-lock it, and map it into
the GPU’s IOMMU. That work is proportional to bytes, and most of it is
per-page kernel work on a single thread.
The cheapest hypothesis is that one giant call is pathological and splitting it up will help, so we test that first.
Step 1: chunking
Replace the one big call with N smaller cuMemAllocHost calls in a loop. If
the cost were super-linear in call size, this would win.
It doesn’t. Throughput is flat at ~3.1 GiB/s from 8 MiB chunks all the way to 32 GiB chunks. The cost isn’t per-call; it’s per-page, and chunking doesn’t change how many pages there are. To go faster we have to attack the per-page work itself — which means getting it out of a closed-source call we can’t modify.
Step 2: mmap
Can we do the per-page work ourselves? Partly. CUDA will pin memory you
allocated yourself: mmap an anonymous region, then hand it to
cuMemHostRegister, which page-locks it and maps it into the IOMMU. The
black box becomes three phases you can time separately:
mmapis ~free — it only reserves virtual address space; no pages yet.- Faulting the pages in is the wall: ~15 s per 64 GiB, or ~4.3 GiB/s.
cuMemHostRegisteron already-resident pages is comparatively cheap.
Serial, this recipe lands at 3.75 GiB/s — barely past the baseline. But the expensive part is now our code, a plain loop of page faults, and page faults are embarrassingly parallel.
Step 3: parallel page faulting
Faulting a page means writing one byte to it so the kernel commits it, and no page’s fault depends on any other’s, so spread the pages across worker threads. What’s the ceiling? Each first touch makes the kernel zero 4 KB of DRAM, so the limit is DRAM write bandwidth — about 100 GiB/s on this box. That’s the target. (The zeroing is mandatory, so the way to stop paying for it is to pool the allocation: fault the pages once and reuse the buffer, which is what a long-lived KV-cache pool does anyway.)
Except the scheduler gets a vote. Left alone, it stacks workers onto the same
cores and migrates them mid-fault, and throughput caps at ~4.3 GiB/s — no
better than Step 2’s serial loop. Pinning each worker to its own logical CPU
with sched_setaffinity is what makes threads add up:
| threads | touch GiB/s |
|---|---|
| 1 | 2.7 |
| 2 | 5.1 |
| 4 | 9.9 |
| 8 | 19.2 |
| 16 | 33.0 |
| 32 | 28.4 |
| 64 | 30.8 |
Core-pinned parallel faulting takes touch to 33 GiB/s and end-to-end allocation to 14.2 GiB/s, 4.6× over the baseline. Core pinning is non-negotiable; it’s in the default.
But the table stalls. Past 16 threads touch sits at roughly a third of the DRAM ceiling no matter how many threads we add — I aimed for 100 and hit 33. Something is serializing the faults.
Step 4: per-VMA fault lock
So what’s serializing the faults? On Linux, every page fault takes a lock on
the VMA — the virtual memory area, the kernel’s bookkeeping object for
one contiguous span of virtual address space that shares the same permissions
and backing. One mmap produces one VMA. Our whole buffer is one mmap, so
every worker, on every fault, contends for the same lock, bouncing one
cacheline across all the cores.
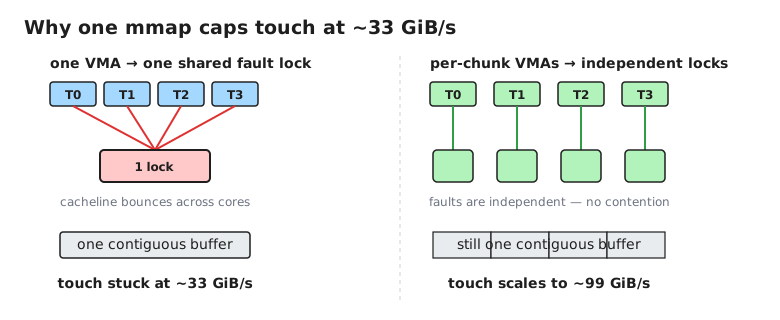
The fix is one VMA per worker, so faults take independent locks. The catch is
contiguity: the KV-cache consumer wants one linear buffer, and the obvious
routes to separate VMAs — N separate mmaps, or PROT_NONE guard pages
between chunks — leave holes in the address range.
One prctl gives both. mmap one contiguous region, then use
prctl(PR_SET_VMA_ANON_NAME) to give each chunk a distinct name. The kernel
refuses to merge adjacent VMAs with different names, so you get N perfectly
adjacent VMAs — N independent fault locks, no guard holes, one linear buffer.
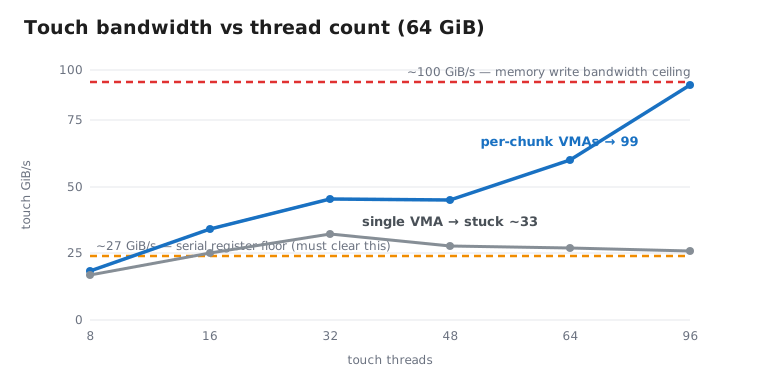
| threads | single VMA | per-chunk VMA |
|---|---|---|
| 8 | 19.1 | 20.4 |
| 16 | 28.0 | 38.3 |
| 32 | 36.1 | 51.1 |
| 48 | 30.9 | 50.2 |
| 64 | 30.1 | 67.2 |
| 96 | 28.8 | 98.8 |
With per-chunk VMAs touch finally scales: the 96-thread row reads ~99 GiB/s, the DRAM write ceiling we were aiming for.
End-to-end allocation reaches 21 GiB/s, 6.8× over the baseline.
NUMA placement — pinning each thread-block to one node so it faults its own half of the buffer — is neutral at the 64 GiB test size but pays off at the 1.5 TiB production size, so it’s on by default.
That closes out touch. The wall has moved to the register phase.
Step 5: pipelining
How much of the wall is register now? Most of it. At 64 GiB the serial recipe
spends 0.65 s touching (99 GiB/s) and 2.37 s registering (27 GiB/s), so
cuMemHostRegister is 78% of the wall-clock.
And register will not parallelize. From 1 to 96 register threads it is dead flat at ~27 GiB/s — presumably serialized on a per-process lock inside the NVIDIA driver, which we cannot split. The move Amdahl leaves is hiding rather than shrinking: make the touch time disappear inside the register time.
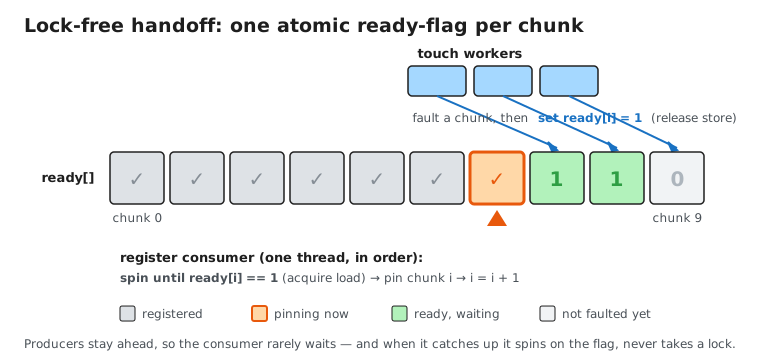
So instead of “touch everything, then register everything,” overlap them: touch workers produce finished chunks; a single register thread consumes them in order. Touch outruns register, so register starts on the first ready chunk and runs back-to-back to the end — the entire touch phase disappears behind it.
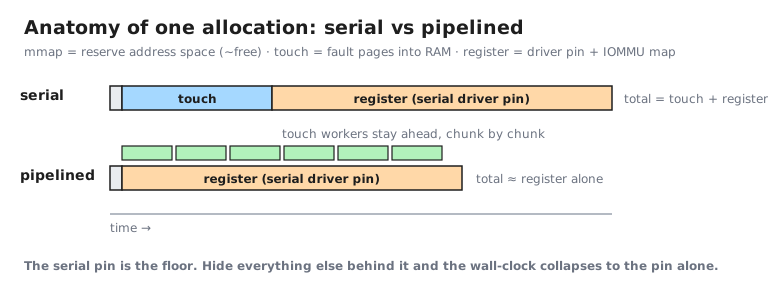
The handoff is a lock-free ready flag per chunk. Two placement details mattered more than the queue itself:
- The register consumer gets a dedicated physical core, not a hyperthread sibling of a touch worker. Sharing a core’s execution units with a toucher drops the pipeline from ~28.3 to ~23.5 GiB/s.
- Fewer touch threads, not more. Touch only has to stay ahead of a ~27 GiB/s consumer: 16 pinned touchers (~38 GiB/s) clear that bar, and every toucher beyond it steals core time and DRAM bandwidth from the register thread — at 48 touchers the pipeline drops to 24.6 GiB/s.
The pipeline lands at 28.3 GiB/s, slightly past the contended ~27 register floor, because register now runs uncontended on its own core — the register-bound limit Amdahl predicts, and then a little more. What’s left is to check it holds at production size.
Where I landed
The final recipe: mmap the buffer; fault it in with core-pinned workers
over per-chunk, name-split, perfectly adjacent VMAs; pipeline the finished
chunks into one serial cuMemHostRegister on its own physical core.
It holds at scale: the production 1.5 TiB allocation that took ~50 minutes now completes in ~5, with no near-full-RAM collapse.
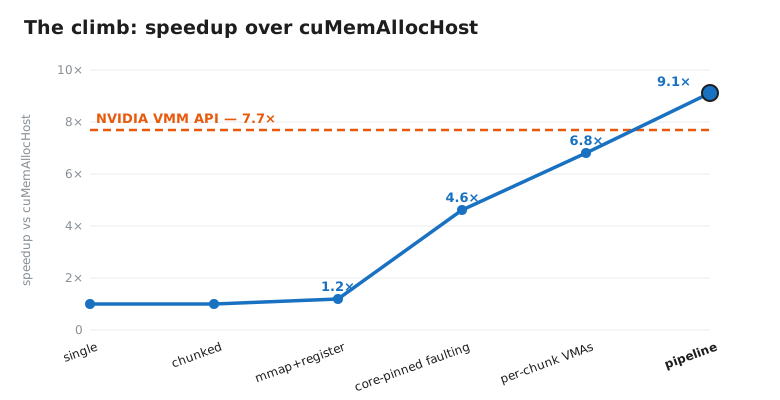
There’s a fairer yardstick than cuMemAllocHost: CUDA’s modern VMM API
(cuMemCreate + cuMemMap + cuMemSetAccess), which does parallelize out
of the box and supports explicit HOST_NUMA placement. It’s genuinely good.
It also tops out at ~24 GiB/s, in the same IOMMU-bound class as everything
else on this host.
The pipeline’s 28.3 GiB/s is 18% past NVIDIA’s best official path and 9.1× past the common one. The serial driver pin is the floor on this host; no API or amount of threading I tried beats it.
One lever went untried: 2 MB hugepages. The remaining cost is per-4 KB-page work — PTE walks and IOMMU programming — and hugepages mean 512× fewer pages, cutting both touch and, more importantly, the serial register floor itself. I skipped them for an operational reason: these servers run in Kubernetes, and the runners expose only a small shared hugepage pool — nowhere near a multi-TiB pinned region. If your deployment can guarantee a large pool, that’s the most promising way past the driver floor.
Conclusion
Two numbers are worth carrying out of this log: allocation went from 3.1 to 28.3 GiB/s, and production startup from about 50 minutes to about 5. The gain came from three moves — do the faulting yourself in parallel, split the per-VMA fault lock with a rename, and hide touch behind the one serial pin the driver imposes.
Hugepages remain the untested way past the floor: fewer pages should shrink even the serial register step, but I never had a pool big enough to verify that, so treat it as a prediction rather than a result.
Thanks to Modular for giving me the room to follow “why is this syscall slow?” all the way to the bottom. If you find yourself staring at a multi-terabyte allocation that takes longer than your coffee break — I hope this saved you a few of those.